Gallery
Every image here comes from an example style in the repository, rendered with
ezu tile or ezu bbox. The style JSON is the whole recipe — copy it, change a
colour, render again.
pencil-sketch
Section titled “pencil-sketch”Ten wave-then-line stroke layers, factored into one user-defined function, plus a
water-hatch function for the sea. This is the front-page render.
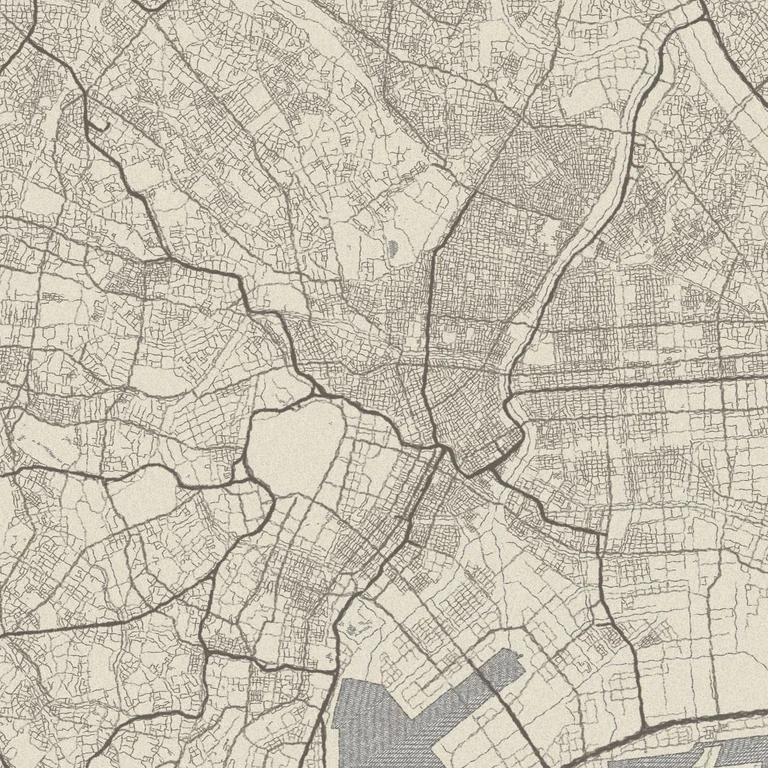
ezu bbox --style crates/ezu/examples/styles/pencil-sketch.json \ --bbox 139.72,35.66,139.80,35.72 --zoom 13 --out pencil.pngStyle: pencil-sketch.json
· Concepts: params and functions
watercolor
Section titled “watercolor”Scatter-dab fills through the hokusai brush engine, anchored in world
coordinates so the wash continues across tile edges. Parametric: paper and
softness are declared knobs.
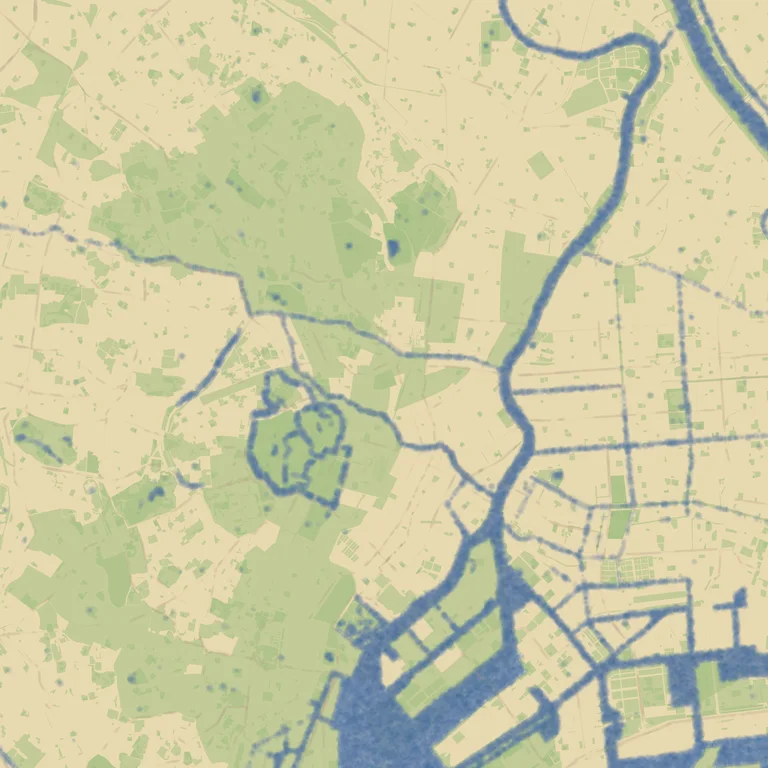
watercolor.json, at its declared defaults.ezu bbox --style crates/ezu/examples/styles/watercolor.json \ --bbox 139.72,35.66,139.80,35.72 --zoom 13 --out water.png
# …or with the knobs turnedezu tile --style crates/ezu/examples/styles/watercolor.json \ --tile 13/7276/3225 --param 'paper=#ffe0f0' --param softness=2 --out water.pngStyle: watercolor.json
hillshade
Section titled “hillshade”Raster-DEM tiles → hillshade + hypsometric tint. All-remote assets, so it
renders straight from a URL with no checkout.
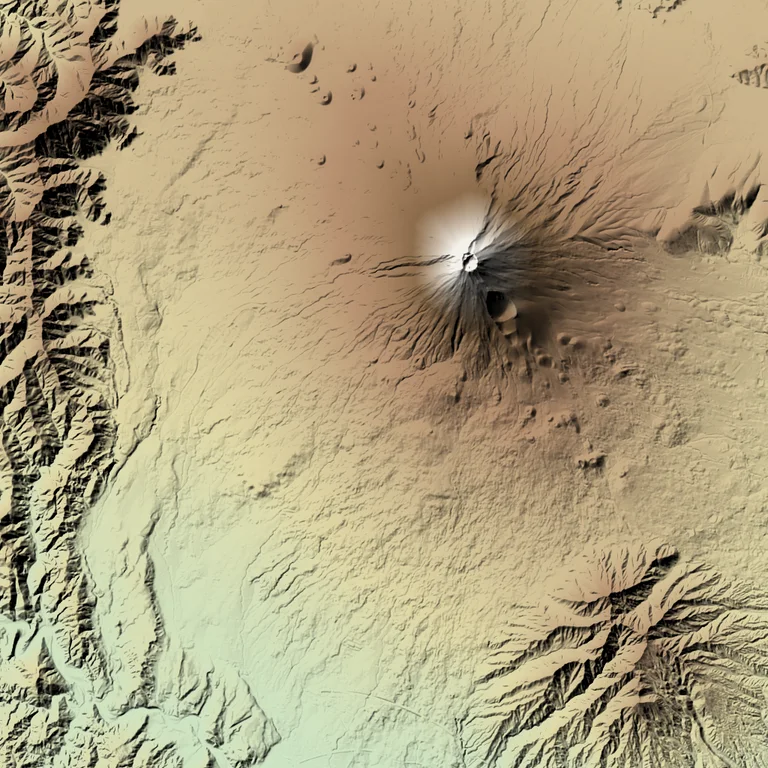
ezu tile --style https://raw.githubusercontent.com/reearth/ezu/main/crates/ezu/examples/styles/hillshade.json \ --tile 11/1813/807 --out fuji.pngStyle: hillshade.json
· Concepts: sources and assets
photo-pop
Section titled “photo-pop”Not a vector style at all: GSI aerial photography pulled in as a raster source,
saturation pushed up with hsl, then posterize to twelve steps per channel.
Four nodes.
ezu bbox --style crates/ezu/examples/styles/photo-pop.json \ --bbox 139.72,35.66,139.80,35.72 --zoom 13 --out pop.pngStyle: photo-pop.json
A plain labelled basemap, written by hand rather than translated. Every label
layer lowers to a text-labels node, all three meet in one label-placement, and
a text-draw per layer paints the winners — so a city name can knock out the road
label underneath it, and the decision is the same from whichever tile you approach
it. Roads are stroke pairs whose widths are interpolate expressions, so one
recipe covers every zoom.
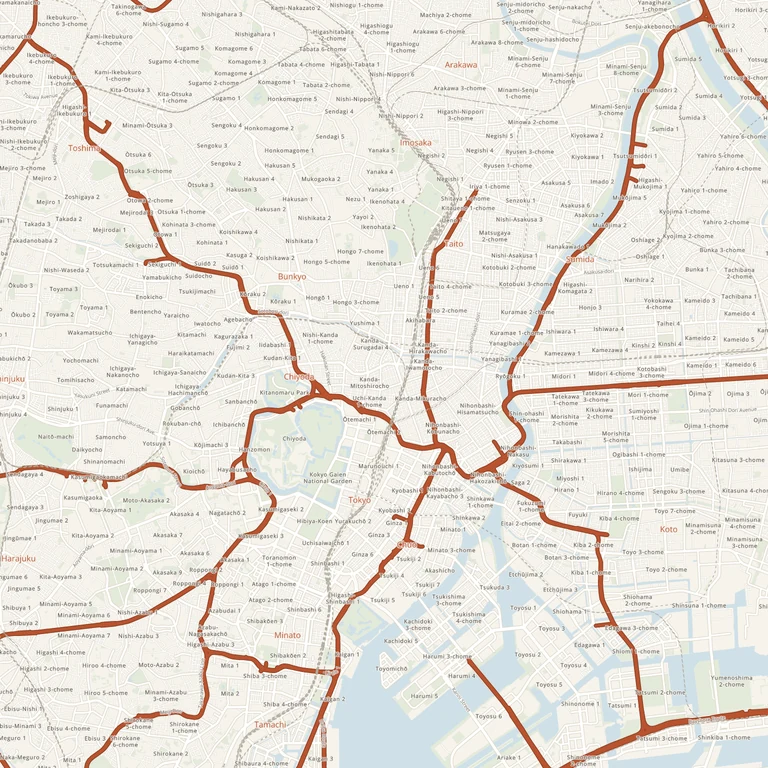
ezu bbox --style crates/ezu/examples/styles/atlas.json \ --bbox 139.72,35.66,139.80,35.72 --zoom 13 --out atlas.pngStyle: atlas.json
· Cookbook: labels and icons
· Concepts: padding and neighbours
risograph
Section titled “risograph”Two drums and a black pass. Area fills print through a halftone screen — a
point-grid of circles used as a blend mask — while linework prints solid, the
way it does on a real duplicator. Each drum’s features are transformed a couple
of pixels out of register, and a closing quantize snaps the whole sheet onto the
ink palette plus its overprints, so nothing survives that the press could not mix.
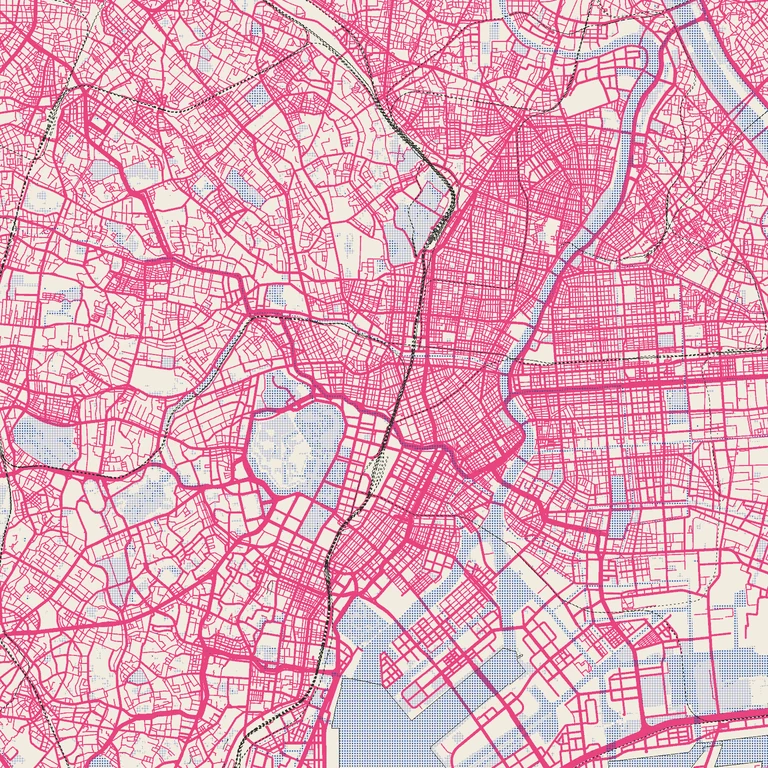
ezu bbox --style crates/ezu/examples/styles/risograph.json \  --bbox 139.72,35.66,139.80,35.72 --zoom 13 --out riso.png
# coarser screen, fatter dotsezu tile --style crates/ezu/examples/styles/risograph.json \  --tile 13/7276/3225 --param screen-px=9 --param dot-px=3 --out riso.png
Style: risograph.json
· Cookbook: halftone and dither
The same DEM tiles as hillshade, read three ways: contour pulls isolines out of
the elevation field as real vector features (stroked twice, thin for the interval
and heavy for every fifth index line), hillshade shades the relief, and slope
feeds a levels → color-to-alpha chain that darkens only the cliff faces. The
index interval is a param, so interval-m and index-every re-cut the contours
without touching the recipe.
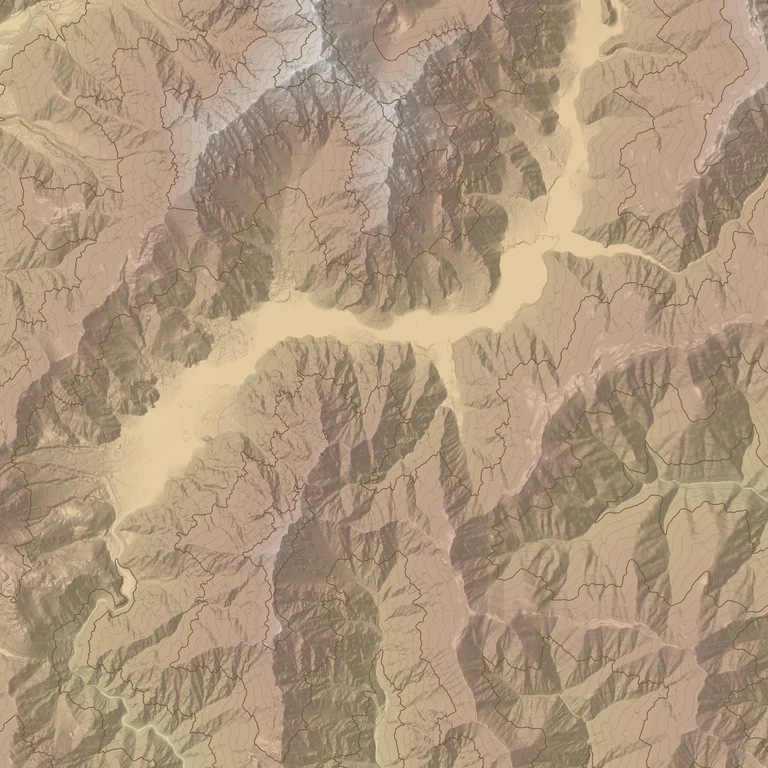
ezu bbox --style crates/ezu/examples/styles/topo.json \  --bbox 137.60,36.20,137.72,36.28 --zoom 13 --out topo.png
# 200 m contours insteadezu tile --style crates/ezu/examples/styles/topo.json \  --tile 13/7253/3229 --param interval-m=200 --out topo.png
Style: topo.json
· Cookbook: hillshade and hypsometric tint
poi-field
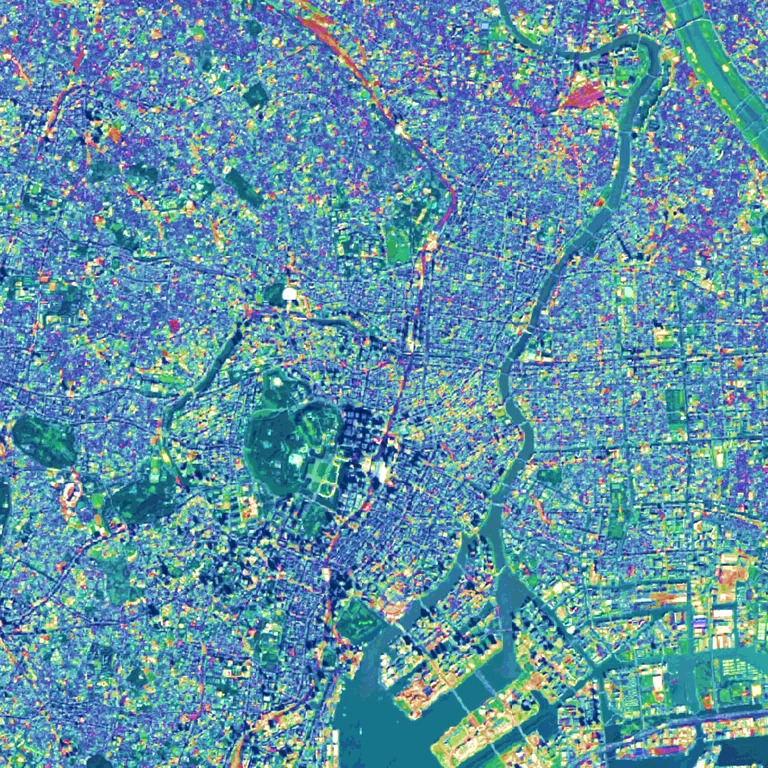
Section titled “poi-field”Analysis rather than cartography: density turns the POI layer into a
kernel-density ScalarField, color-ramp colours it through a MapLibre
heatmap-color expression (ramp-expr), and the same field goes into contour a
second time to draw isolines over the heat — including a single heavier line at the
0.75 level. Kernel radius and isoline interval are params.
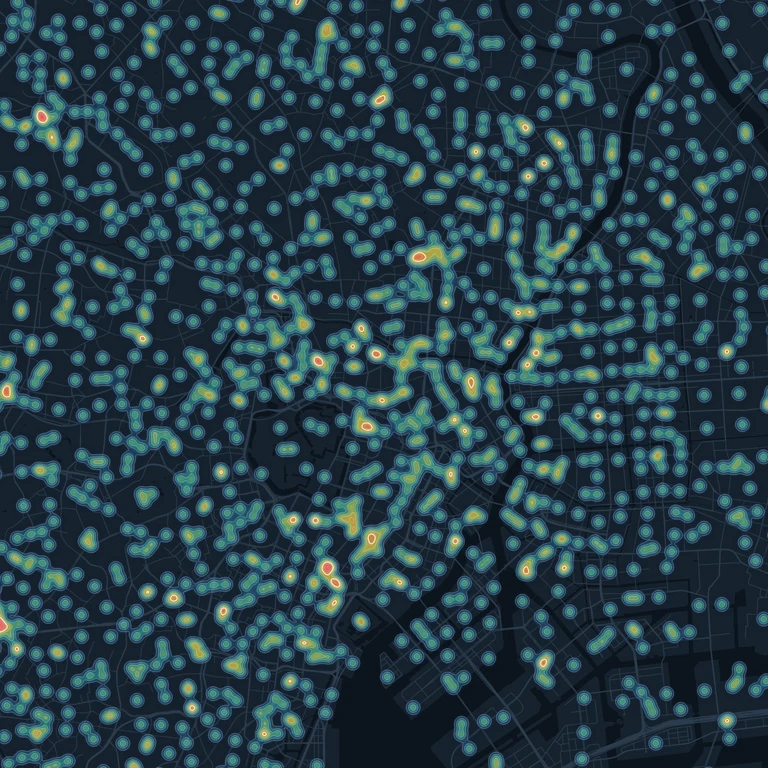
ezu bbox --style crates/ezu/examples/styles/poi-field.json \  --bbox 139.72,35.66,139.80,35.72 --zoom 13 --out field.png
# wider kernel, coarser isolinesezu tile --style crates/ezu/examples/styles/poi-field.json \  --tile 13/7276/3225 --param radius-px=48 --param step=0.2 --out field.png
Style: poi-field.json
· Concepts: ports and types
stained-glass
Section titled “stained-glass”Geometry ops as the whole design. voronoi-fracture breaks the land, water, and
park polygons into panes around seed points — the POI layer where it has points, a
point-grid where it does not — and boundary + stroke turns every pane edge
into leading. Pane colour comes from a world-anchored cell noise — one random
value per noise cell — mapped through an HCL ramp and clipped to the panes, so
neighbouring glass differs without any per-cell attribute to key on.
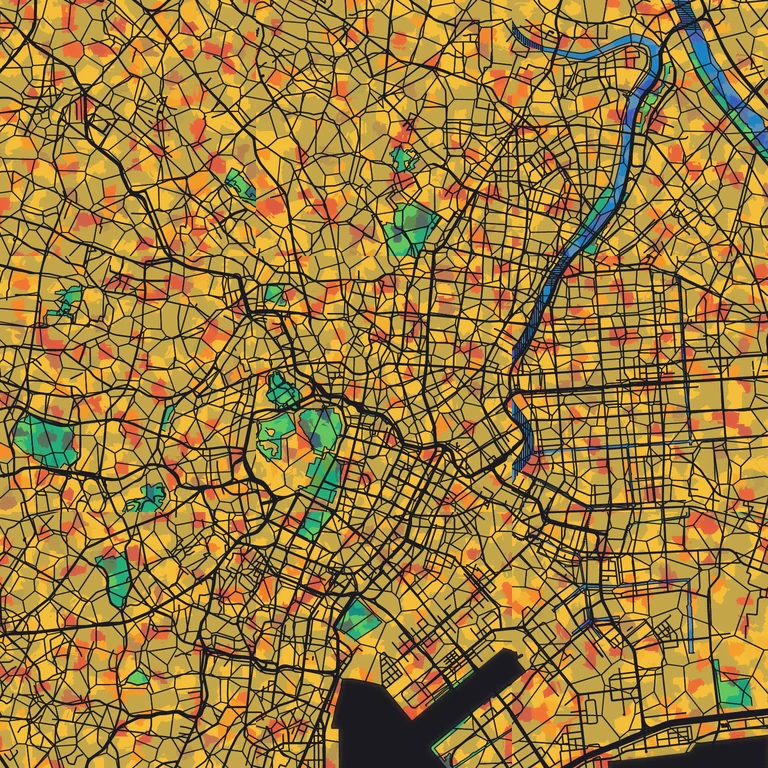
ezu bbox --style crates/ezu/examples/styles/stained-glass.json \ --bbox 139.72,35.66,139.80,35.72 --zoom 13 --out glass.pngStyle: stained-glass.json
· Nodes: geometry
A translated MapLibre basemap
Section titled “A translated MapLibre basemap”Not painterly at all: a Protomaps basemap MapLibre style, converted with
ezu translate and rendered by ezu, labels included. This is the render
ezu-compare pixel-diffs against maplibre-gl-js.
ezu translate https://api.protomaps.com/styles/v5/light/en.json --out recipe.jsonezu tile --style recipe.json --tile 14/14550/6452 --out basemap.pngGuide: from a MapLibre style
Credits
Section titled “Credits”The renders on this page are made from other people’s data, and the licences ask for credit:
- watercolor, pencil-sketch, photo-pop (vector), atlas, risograph, poi-field, stained-glass, the Protomaps basemap — OpenStreetMap via Protomaps, © OpenStreetMap contributors.
- hillshade, topo — elevation from Re:Earth Terrain (Mapterhorn-merged global DEM blended with EGM2008 geoid undulations): Re:Earth Terrain, Mapterhorn, EGM2008 (NGA).
- atlas lettering — Open Sans by Steve Matteson, under the SIL Open Font License.
- photo-pop — aerial imagery from GSI Japan, © 国土地理院.
- Brushes — CC0, by David Revoy.
ezu tracks this for you at render time: a source inherits attribution from its
TileJSON or PMTiles metadata, Document::attributions() returns the merged list,
and ezu serve exposes it at GET /style/attribution. Whatever your tiles end
up in, render it — see serve tiles.
Map renders on this site are made fromOpenStreetMap data viaProtomaps (© OpenStreetMap contributors), elevation from Re:Earth Terrain,Mapterhorn andEGM2008 (NGA), and aerial imagery from GSI Japan(© 国土地理院). The painterly styles use CC0 brushes byDavid Revoy.